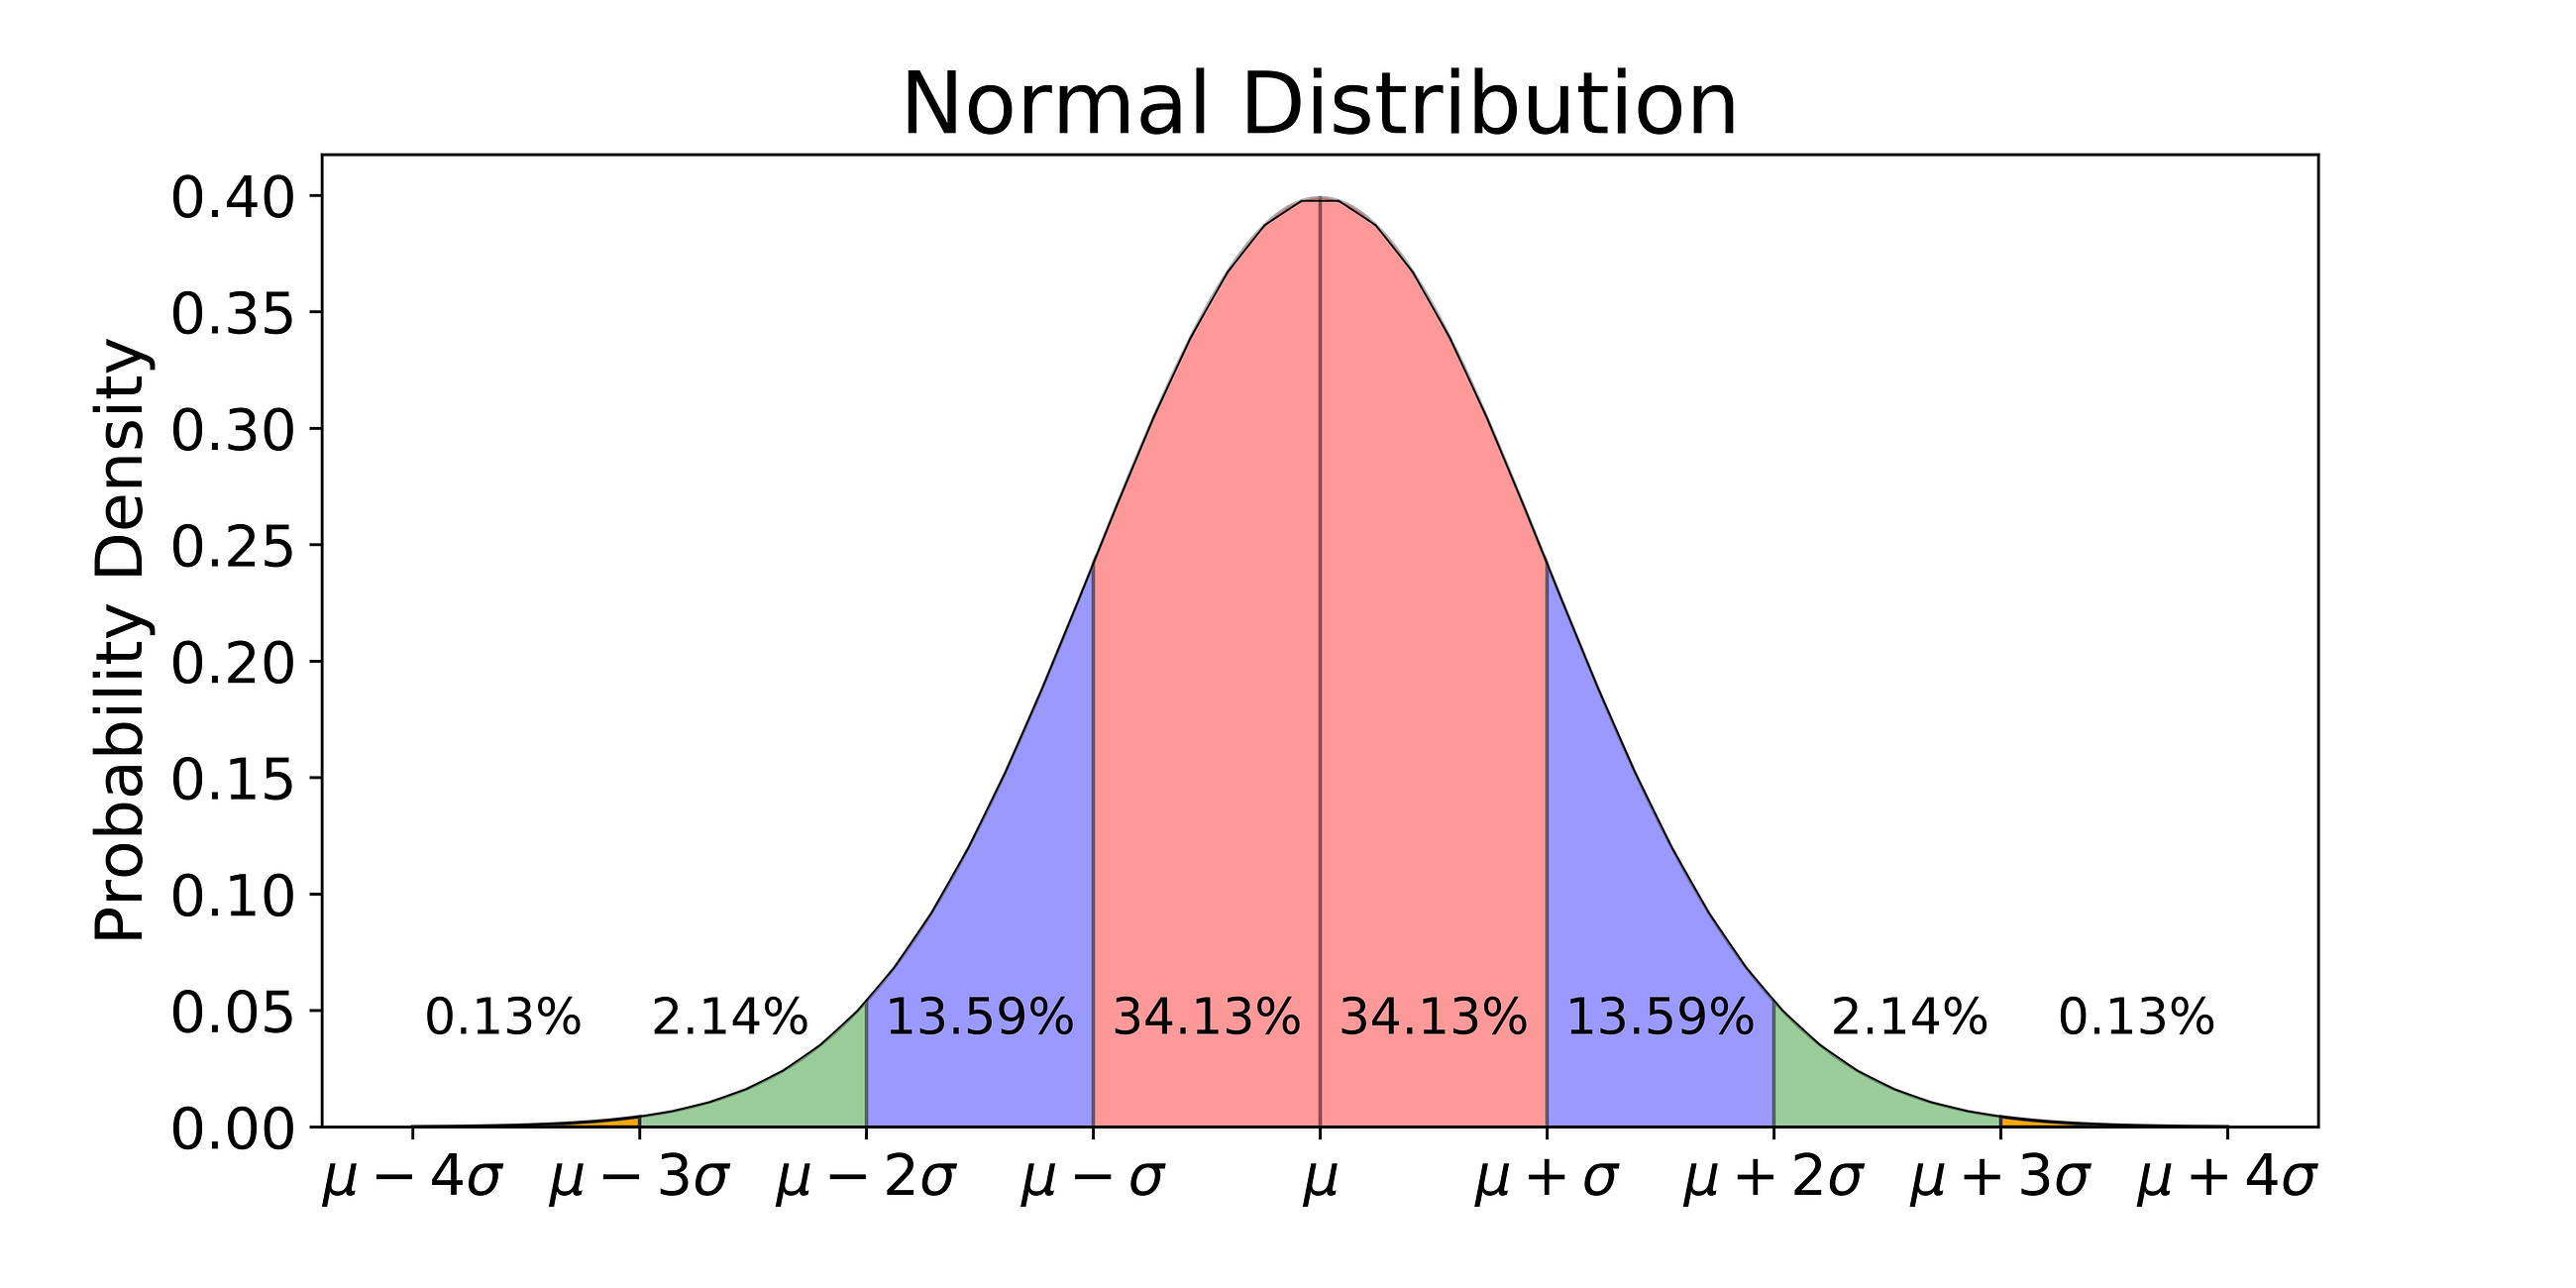
The normal distribution curve can be used to assign probabilities to values. Every data point can be condensed into two numbers, the mean of the curve which measures the average, and the variance, which measures the dispersion of the curve.
The normal distribution curve is symmetric about their mean and finds application in many areas of nature. The average height of the test scores, size of flora and fauna, life spans can all be modelled by the normal distribution curve. A very important theorem is the central limit theorem, where adding or averaging the random variables produces a normal distribution curve.
Are there different kinds of distributions ?
When random variables are added together, the resulting distribution curve is likely to be normal. But when random variables are multiplied together, a different distribution curve results. This is a lognormal distribution.
Salary raises are typically expressed as a percentage increment. So folks with higher salaries receive a higher increment for the same percentage raise.Because of this, the income of population tends to follow a lognormal distribution curve. Notice that larger variances in a lognormal distribution curve tends to result in fatter tails to the right.
The lognormal distribution possibly provides a better explanation as to why inequality in our society exists - increments are expressed in percentages so higher paid professionals are given higher increments. Things would be very different is increments are expressed in absolute figures - we might even end up with a gentler form of capitalism.
Financial professionals often have no choice but to express market returns as being normally distributed. When they have to work with actual stock market levels, they apply a logarithmic function before feeding it into a regression exercise.
The truth is that most of us are aware that markets generally do not follow a normal distribution, but we are often forced to because more complicated distribution functions ( possibly suggested by Nichola Taleb ) may not even have a means of defining the variance of the distribution.
You can read about how the abuse of a mathematical function was probably what almost killed the markets in 2007 here.
Haha so the Env minister (or his scholar underlings) should have used a lognormal distribution instead of using the Sec 2 maths explanation of 1 in 50 years (actually 1.25 in 50). :P
ReplyDeleteIntuitively, market returns as a whole appears to be lognormal with a -ve skew i.e. fatter left tail.
While markets tend to produce +ve returns and more +ve years over the long run, extreme -ve years tend to produce much larger quantums as opposed to extreme +ve years.
But maybe that's just my bias coz my investment memory only extends back to the mid-1990s.
Unknown,
ReplyDeleteYou brought up an interesting perspective.
Let me make some guess as to why you have such observations.
Because we express returns in percentage changes, the returns itself is generally approximated to be a normal distribution rather than a lognormal distribution. ( Log normal distribution refers to the level of the STI rather than the returns. ) So normally unless you have a very nifty strategy, it rarely skews to the right.
It skews to the left because you have a fairly decent strategy but it captures hidden risks like credit risks or liquidity risk.
Regards